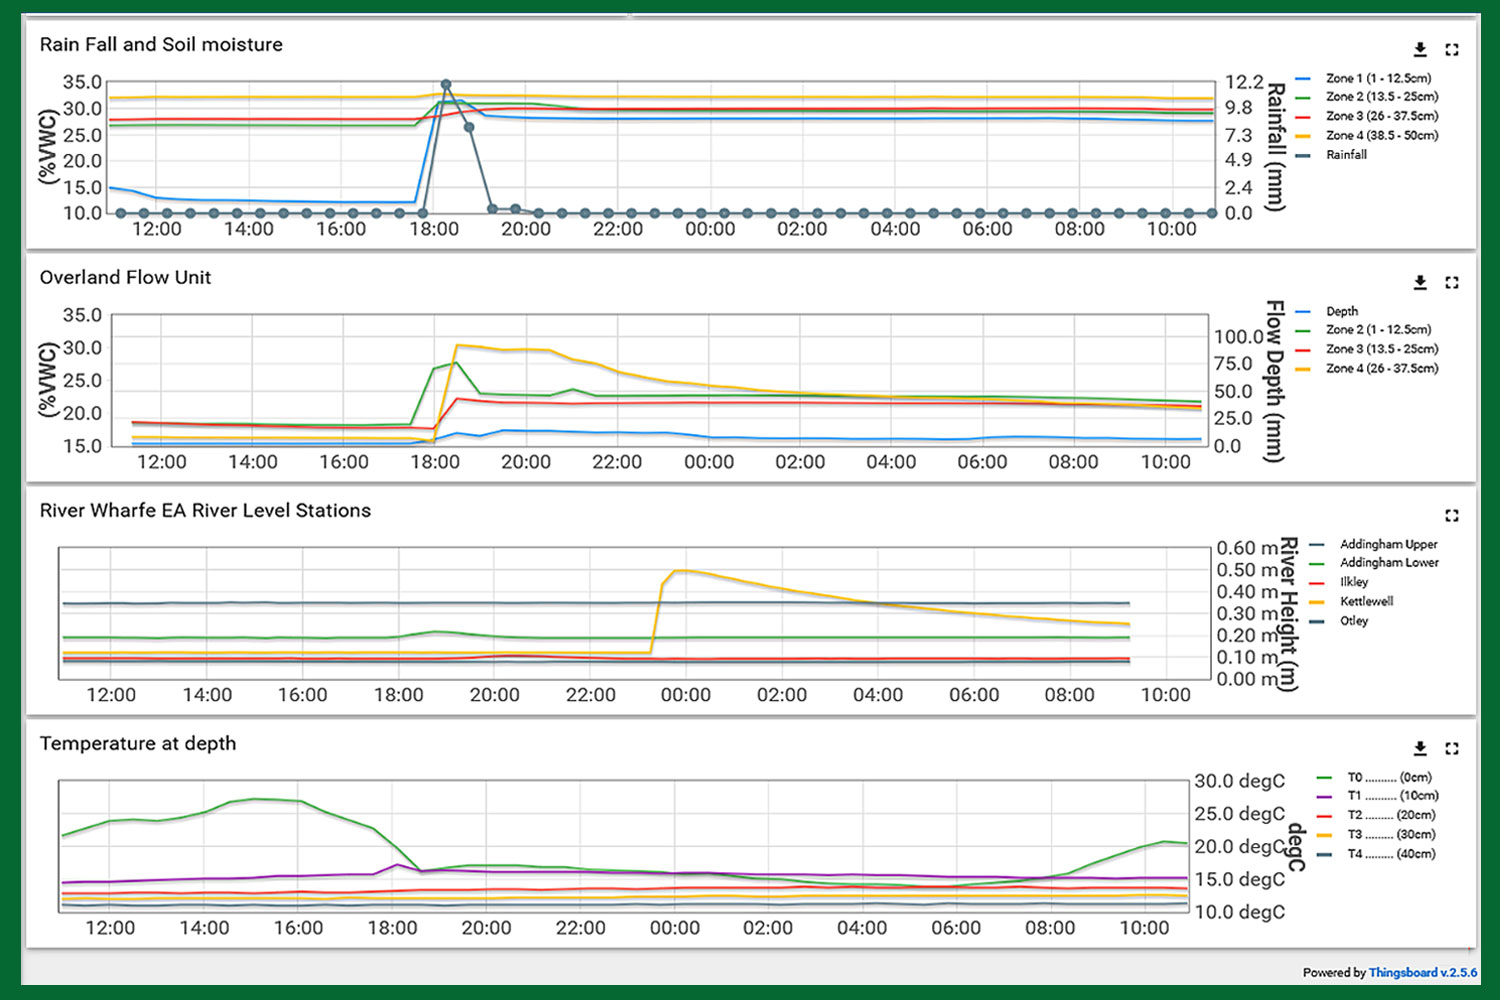
A short, sudden burst of rain began just before 20:00 yesterday (11 June 2023) near Oughtershaw, North Yorkshire where we are monitoring a catchment at the top of the Wharfe River.
1st Graph – Moisture & Rainfall: 12.2mm of rain immediately affected Zone 1 of this unit, with lesser effects in the lower zones as the water sinks in.
2nd Graph – Overland Flow: The Overland Flow unit which monitors runoff is situated a few yards away from this unit. The blue line shows that at one point, there was as much as 14.5mm of water flowing over the surface of the ground.
3rd Graph – River Levels: Notice the sudden spike in the nearest Environmental Agency river reading site which is located about 9 miles down river at Kettlewell. The moisture from the rainstorm took about 3.5 hours to make it to the Kettlewell river gauge.
4th Graph – Temperature: You can see how the rainstorm quickly cooled the temperature of the soil at the surface.
Overall, this is a good example of how a strong localised rainstorm in the middle of a dry period can ripple cleanly through the various data parameters, providing a clear view of what has just happened.